This article describes Power BI Bookmarks tips, tricks, and best practices. Bookmarks are a powerful feature that can greatly improve the reader’s experience. However, there are several settings you should be aware of. Used incorrectly, they can become hard to maintain and often not display the intended functionality.
Power BI Bookmarks
This article will assume some basic knowledge on how to record or apply bookmarks. Please see this. If you are new to Bookmarks, you may want to watch this helpful video by Adam Saxton from Guy In A Cube.
It will run through an example of using a switch visuals bookmark group. If you have not seen this before, I suggest you watch this video, also by Guy In A Cube.
You should be familiar with:
The rest of the article will focus on some tricks and tips using bookmarks, while walking through an example of a visual switch between a map and a graph.
Tips Covered
- Change Power BI Bookmark Settings
- Rename Your Visuals
- Record Power BI Bookmarks on Groups
- Add Placeholder Groups to Easily add More Visuals
- Rename and Group Bookmarks
- Layers
- Keep it Tidy
- Final Words
Change Power BI Bookmark Settings
You should always update the bookmark settings when creating them. This should always be as specific as possible to the action they are trying to achieve.
Here is a quick breakdown of the settings:
Data: This captures items including filters and sort order. It does not capture if the item is visible or not.
Display: This captures whether an item is visible or not, without modifying filters or sort order.
Current Page: This will switch to the current page view if you apply the bookmark from a different page. If unselected, it will still apply the bookmark, but it will stay on the page you apply it from.
All Visuals: If this option is selected, it captures every setting on the page. This can include items in the filter pane, or even if the filter pane is open. I would recommend to never use this setting.
Selected Visuals: Selected visuals still only apply bookmarks to the visuals you had selected when you record the bookmark. You can select items by holding control and clicking on them in the selection pane.
In general, I try not to use both Data and Display together, as most cases bookmarks are just changing one of these fields. Previously, it was required to use bookmarks to navigate pages. However, this is no longer needed after new functionality allows this to be done with buttons directly. Therefore, I rarely use this feature.
One of the best Power BI Bookmarks tips – use selected visuals only. Recording bookmarks on all visuals often has unintended consequences and can be difficult to manage. Rarely is this needed and can become very hard when adding more visuals to the page.
Rename Your Visuals
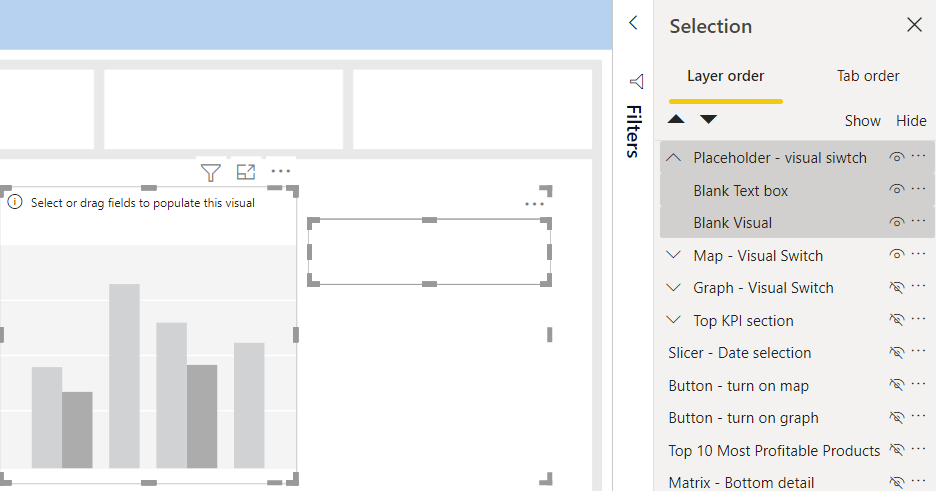
The first tip is to rename your visuals. Each visual is given a name, which can be viewed in the Selection Pane. By default, the name is usually the type of visual it is. This means if you have several slicers on a page, you might get a list of several visuals with the same name. While this is not an end user feature, it can make it difficult to identify the correct visual when developing.
We recommend renaming each visual when you add it. First, open the selection pane. Next, double click on the visual you have just added in the selection pane. Rename the visual to something that calls out what it is. Our recommended naming strategy is the following.
Visual - Description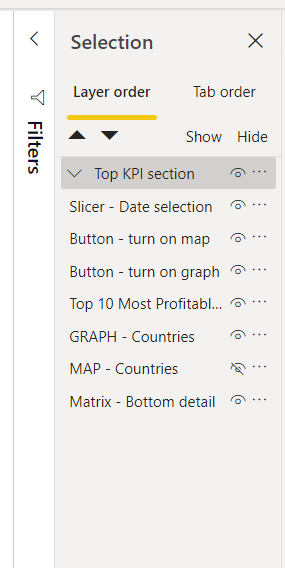
Pro Tip: When a page contains multiple bookmarks it’s difficult to know what Bookmark touches which Visuals or Groups. Thus, when you are planning multiple bookmarks on a single page add an ID at the end of the Visual or Group. This will correspond to a number listed at the end of the Bookmark.
Record Power BI Bookmarks on Groups
Using groups has huge benefits for Power BI bookmarks. If you record bookmarks on groups instead of individual visuals. Now, any edits made on the content of the groups will flow through, without the need to re-record bookmarks.
For example, let’s say I want a bookmark that switches a visual from a table to a map.
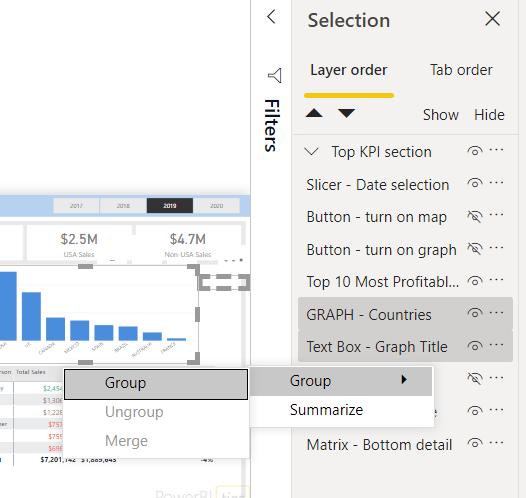
First, I’m going to make the groups. Open the selection pane. Whilst holding control, click on each visual that should be in the group. Right-Click on one of the selected visuals, then click the list option named Group then in the sub menu Group. You should also rename the group, so you know what it contains.
Note that to set up a group, you need at least two visuals. In my example, I have a graph visual and a title. If you have just one, you can still set up a group. Simply add a blank text box or shape and group it with your visual. You can then delete the blank text box or shape and the group will persist.
HINT: Elements can be difficult to move or select after grouping. If you want to modify a visual, use the selection pane to select it easily. If you want to move it, click and drag the ellipsis to move it.
Add Placeholder Groups to Easily add More Visuals
Next, I will set up the remaining groups. Aside from the map group, I’m also going to add some placeholder groups. To do this, I will add a blank visual and a blank text box.
Next, I’m going to select the new group. Then I’m going to copy and paste using Control-C and Control-V to create three placeholders.
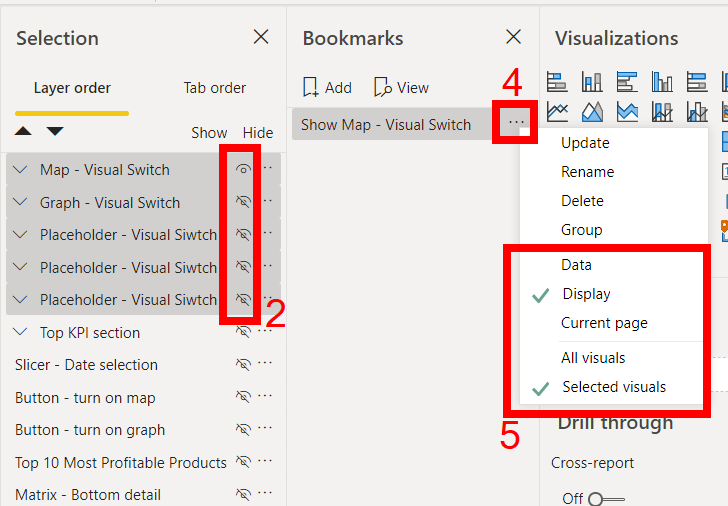
Now that all the groups are set up, it is time to record the bookmarks! For each group follow these steps:
- Using control, select all visual groups including the placeholders.
- Using the eye, hide all visual groups except the Map – Visual Switch.
- Rename the bookmark in the bookmark pane by double clicking it.
- Click the ellipsis to open the bookmark settings.
- Deselect Data and Current Page. Change to Selected Visuals. The settings should look like the picture above.
Rename and Group Bookmarks
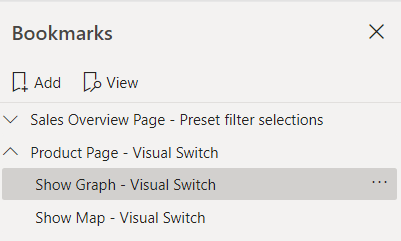
Two more Power BI Bookmarks Tips are to rename the bookmarks and to group them. In addition to renaming your visuals when adding them, you should also rename your bookmarks. For the bookmarks themselves, I do action name – function.
Secondly, you should group similar bookmarks together. For example, the bookmarks in the visual switch should be put in the same group. This group can also be renamed. I often like to include the page name in the group and then its function.
Pro Tip: You will want to provide a connection between the bookmarks and the visual elements on the page. By adding an ID at the end of the Visual or Group and the Bookmark you can create a traceable link. This is especially important when you have multiple repot developers working on the same report. Adding an ID signals to the next report developer that these bookmarks are influencing the associated items on the Selection pane.
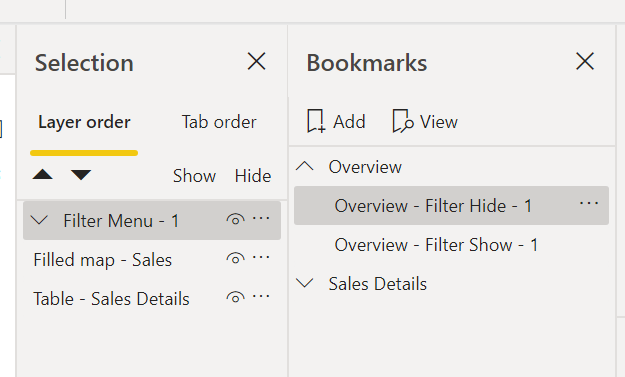
Layers
For this section, you should be familiar with the selection pane. Remember that objects at the top of the selection pane are in front of those below it.
Now that we have our groups, it makes it simpler to have buttons. In my example, I will create a button that says Graph, plus a button that says Map. If we are switching visuals, it is useful to have highlighted what visual is presented. I will highlight with a blue background and bold text.
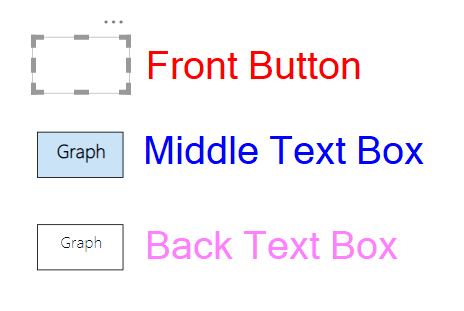
One way of doing this, is to layer text boxes behind the buttons. First, create the buttons at the that will contain the bookmark action. This button will be see-through and slightly larger than the text boxes.
Next, create the middle text boxes that formatted for the selected button name.
Finally, create the back text boxes that are formatted for the unselected button name.
Keep it Tidy
Once we have repeated for all buttons, we can tidy it up. First, place all button elements in the same position on the page. You can do this easily using the align function.
Then, place the middle text box inside the group it relates to. This means when the bookmark is applied, the selected format will be visible for the correct visual. The trick is that we will layer the elements, so this text box will appear in front of the unselected text box. The buttons will always be on top, so the functionality will always remain the same.
Group the front buttons together, and make sure they are in front of the text boxes. These control the functionality of the Power BI Bookmarks.
Group the back text boxes together, and make sure they are at the back.
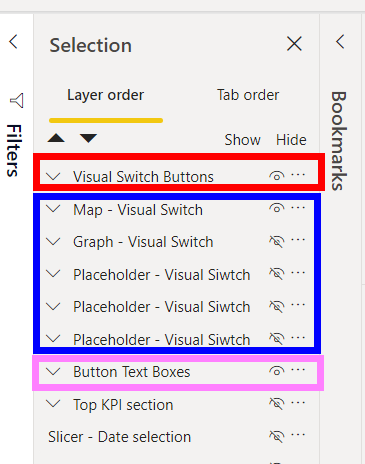
The layer sets:
Visual Switch Buttons: These are the buttons that apply the bookmarks. This is the top layer and always visible. This contains the Front Buttons.
Visual Switch Groups: This is the groups we set up earlier. This contains the text box that shows the highlighted button name. As the text boxes are part of the groups, only the selected one is visible. The is the middle layer. This contains the middle text boxes.
Button Text Boxes: This contains the text boxes that go at the back and show the unselected value. This contains the Back Text Boxes.
Final Words
Out of all the Power BI Bookmarks tips, the one I would stress the most is: use the selected visuals setting. It will make your reports much easier to maintain!
If you are not convinced to use bookmark groups, it was recently announced at MBAS 2021 some extra functionality. This will allow users to apply whole bookmark groups to a page, automatically adding buttons when you add extra bookmarks.
I also described a similar tip using buttons almost two years ago. This uses slightly more advanced technique, and some functionality was not out then that is now. However, it is still valid and a viable option.
If you like the content from PowerBI.Tips please follow us on all the social outlets. Stay up to date on all the latest features and free tutorials. Subscribe to our YouTube Channel. Or follow us on the social channels, Twitter and LinkedIn where we will post all the announcements for new tutorials and content.
Introducing our PowerBI.tips SWAG store. Check out all the fun PowerBI.tips clothing and products:
Check out the new Merch!